Dashboard Summary
The Rollup Economics dashboard, created by @niftytable, provides a comprehensive overview of the economic health of various rollups in the crypto space. It tracks key metrics such as transaction fees, data publication costs, and profits, among others. The dashboard also includes data on developer activity and usage, offering a holistic view of the rollup’s economy.
Data Points
- Revenue (ETH) from L2 Transaction Fees
- Cost (ETH) of Publishing Transaction Data to L1
- Profit (ETH)
- Data Published (MB) to L1
- Cost (ETH) of Verifying Proofs on L1
- Monthly Contracts Creators
- Transaction Data Published to L1
- Usage [In Development]
- Proof Data Posted to L1
- Costs: Verifying Proofs on L1
- Costs: Posting Transaction Data to L1
- Profit: L2 Transaction Fees Earned – L1 Data and Verification Costs
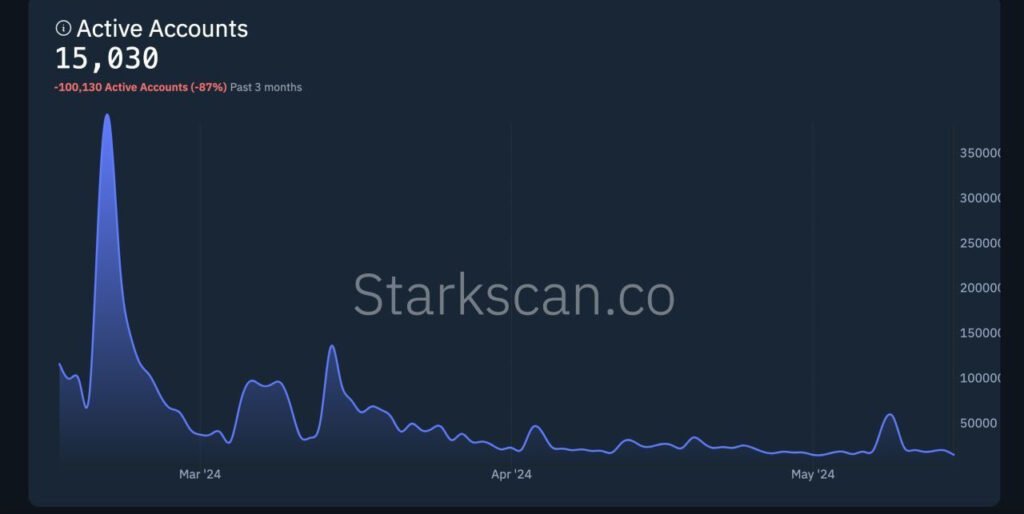
- Developer Activity


